Moving a four-team Excel process into one tool
A global retailer had four teams running one huge process on Excel. This tool replaced it, with an AI agent that flags what’s off, so nobody has to go through every single number.
- Client
- A global retailer (enterprise retail)
- Role
- Sole designer
- Process
- Analyst interviews, OOUX, flows, testing
- Timeline
- 3–4 months
At a glance
What moved
- Per cycle, down from ~210
~45 h
Per cycle, down from ~210
- Calibration loop, down from two to three weeks
Days
Calibration loop, down from two to three weeks
- Monthly saving realised for the first business unit
$3.5K
Monthly saving realised for the first business unit
- Teams moved from sequential to parallel
4
Teams moved from sequential to parallel
Problem
Market-share numbers took days to calculate and weeks to agree on. Four teams edited them one after another, and because the numbers roll up, a late edit from one team could undo another team’s sign-off without anyone noticing.
What was wrong with Excel
Excel had all the functions, right? The maths was never the problem. The problem was everything around it.
- Four teams, one file, one after the other. Analysts, then category leads, then finance, then sign-off. And every team has multiple people working on it.
- You have to go through each number. Hundreds of rows, each product. Under Clothing, under Women’s wear, there’s something you need to change, but you don’t know which one. So you deep dive into all of it.
- Nothing tells you what’s off. No flags, no threshold. You find a problem only if you happen to look at that row.
- A late edit can undo someone’s sign-off. The numbers roll up. So if someone changes something at the bottom, the total another team already agreed on changes too, and nobody notices.
- It takes weeks. Days to calculate, weeks to agree on.
What was delivered
So this is a tool built for them, like a proper calibration tool. It keeps what Excel was good at and fixes how the four teams work with it.
| In Excel | In the tool |
|---|---|
| Four teams passing one file around | Stages. You finish yours, then the next team unlocks |
| Going through each number | The AI agent goes through it first and gives you the numbers |
| Finding problems by luck | Anything above or below the threshold gets flagged |
| A late edit quietly breaking a sign-off | Before you complete a stage, you see what your changes affect, including numbers someone already signed off |
| Weeks of back and forth | You only change the few numbers you feel like changing, based on your experience |
Role: Sole designer. Analyst interviews, OOUX, flows, testing and all the screens.
The new tool: AI in the loop
So where does the AI come in? The analysts weren’t short on experience, right? They were short on time. Most of the day went into finding the numbers, not fixing them.
So that’s what the agentic AI does:
- It goes through everything first. Every row, before anyone even opens their stage.
- It flags the numbers that look off. If something goes above or below the threshold, it gets flagged.
- It gives you the numbers. For each flag, it suggests what the number should be.
But the AI doesn’t decide anything on its own. The analyst still makes the call, and nothing moves to the next team until a person completes the stage.
A day in the life
Let’s say you’re an analyst on this, and you’re in charge of Clothing.
In Excel
- 1
You open the file.
It’s your team’s turn now, but there are a bunch of you in it, all working on your own bits.
- 2
You need to go through each number.
Hundreds of rows, each product. Somewhere under Clothing, under Women’s wear, there’s something you need to change. But which one? So you deep dive into all of it.
- 3
Tops looks high. Or maybe it doesn’t?
You check it against another tab, and you’re still not sure. You leave a note: “recheck??”
- 4
You change a few numbers and tell everyone you’re done.
Then the file goes to the category leads. Then finance. Then sign-off.
- 5
Then someone changes something at the bottom.
It rolls up, and the total you already agreed on is different now. Nobody notices.
And this goes on for weeks.
Same day, with the tool
- 1
You open your stage.
It’s your team’s turn, and the tool knows that. Nobody from the next team can jump in early.
- 2
You can see where the flags are.
The AI already went through everything. Women’s wear has 3 flags, so you go there first.
- 3
Tops is flagged, way above the threshold.
The AI gives you a number. You change it a little based on your experience.
- 4
The other two look fine,
so you just accept what the AI gave.
- 5
Before you complete, you see what your changes affect.
If it touches something another team already signed off, you know right away.
- 6
You complete your stage.
The category leads unlock and can start.
That’s it. You only touch the numbers that actually need you.
The process
- Analyst interviews. Talked to the analysts to see how they actually do this in Excel today, and where the time really goes.
- OOUX. Mapped out the objects, like categories, products, numbers, stages and teams, and how they connect. This is where the roll-up problem became really clear.
- Flows. For each of the four teams: who does what, and when the next team unlocks.
- Testing. Ran the flows with the people who’d actually use the tool.
One thing that came up in both the interviews and the testing: a little rigidness about moving from Excel to a tool. People know Excel, right? They’ve used it for years.
So to understand that rigidness, we went through what their day actually looks like, step by step. Then we redesigned the workflow around it, to save them time and make the tool easy to use. If the new way isn’t clearly faster and easier, nobody’s leaving Excel.
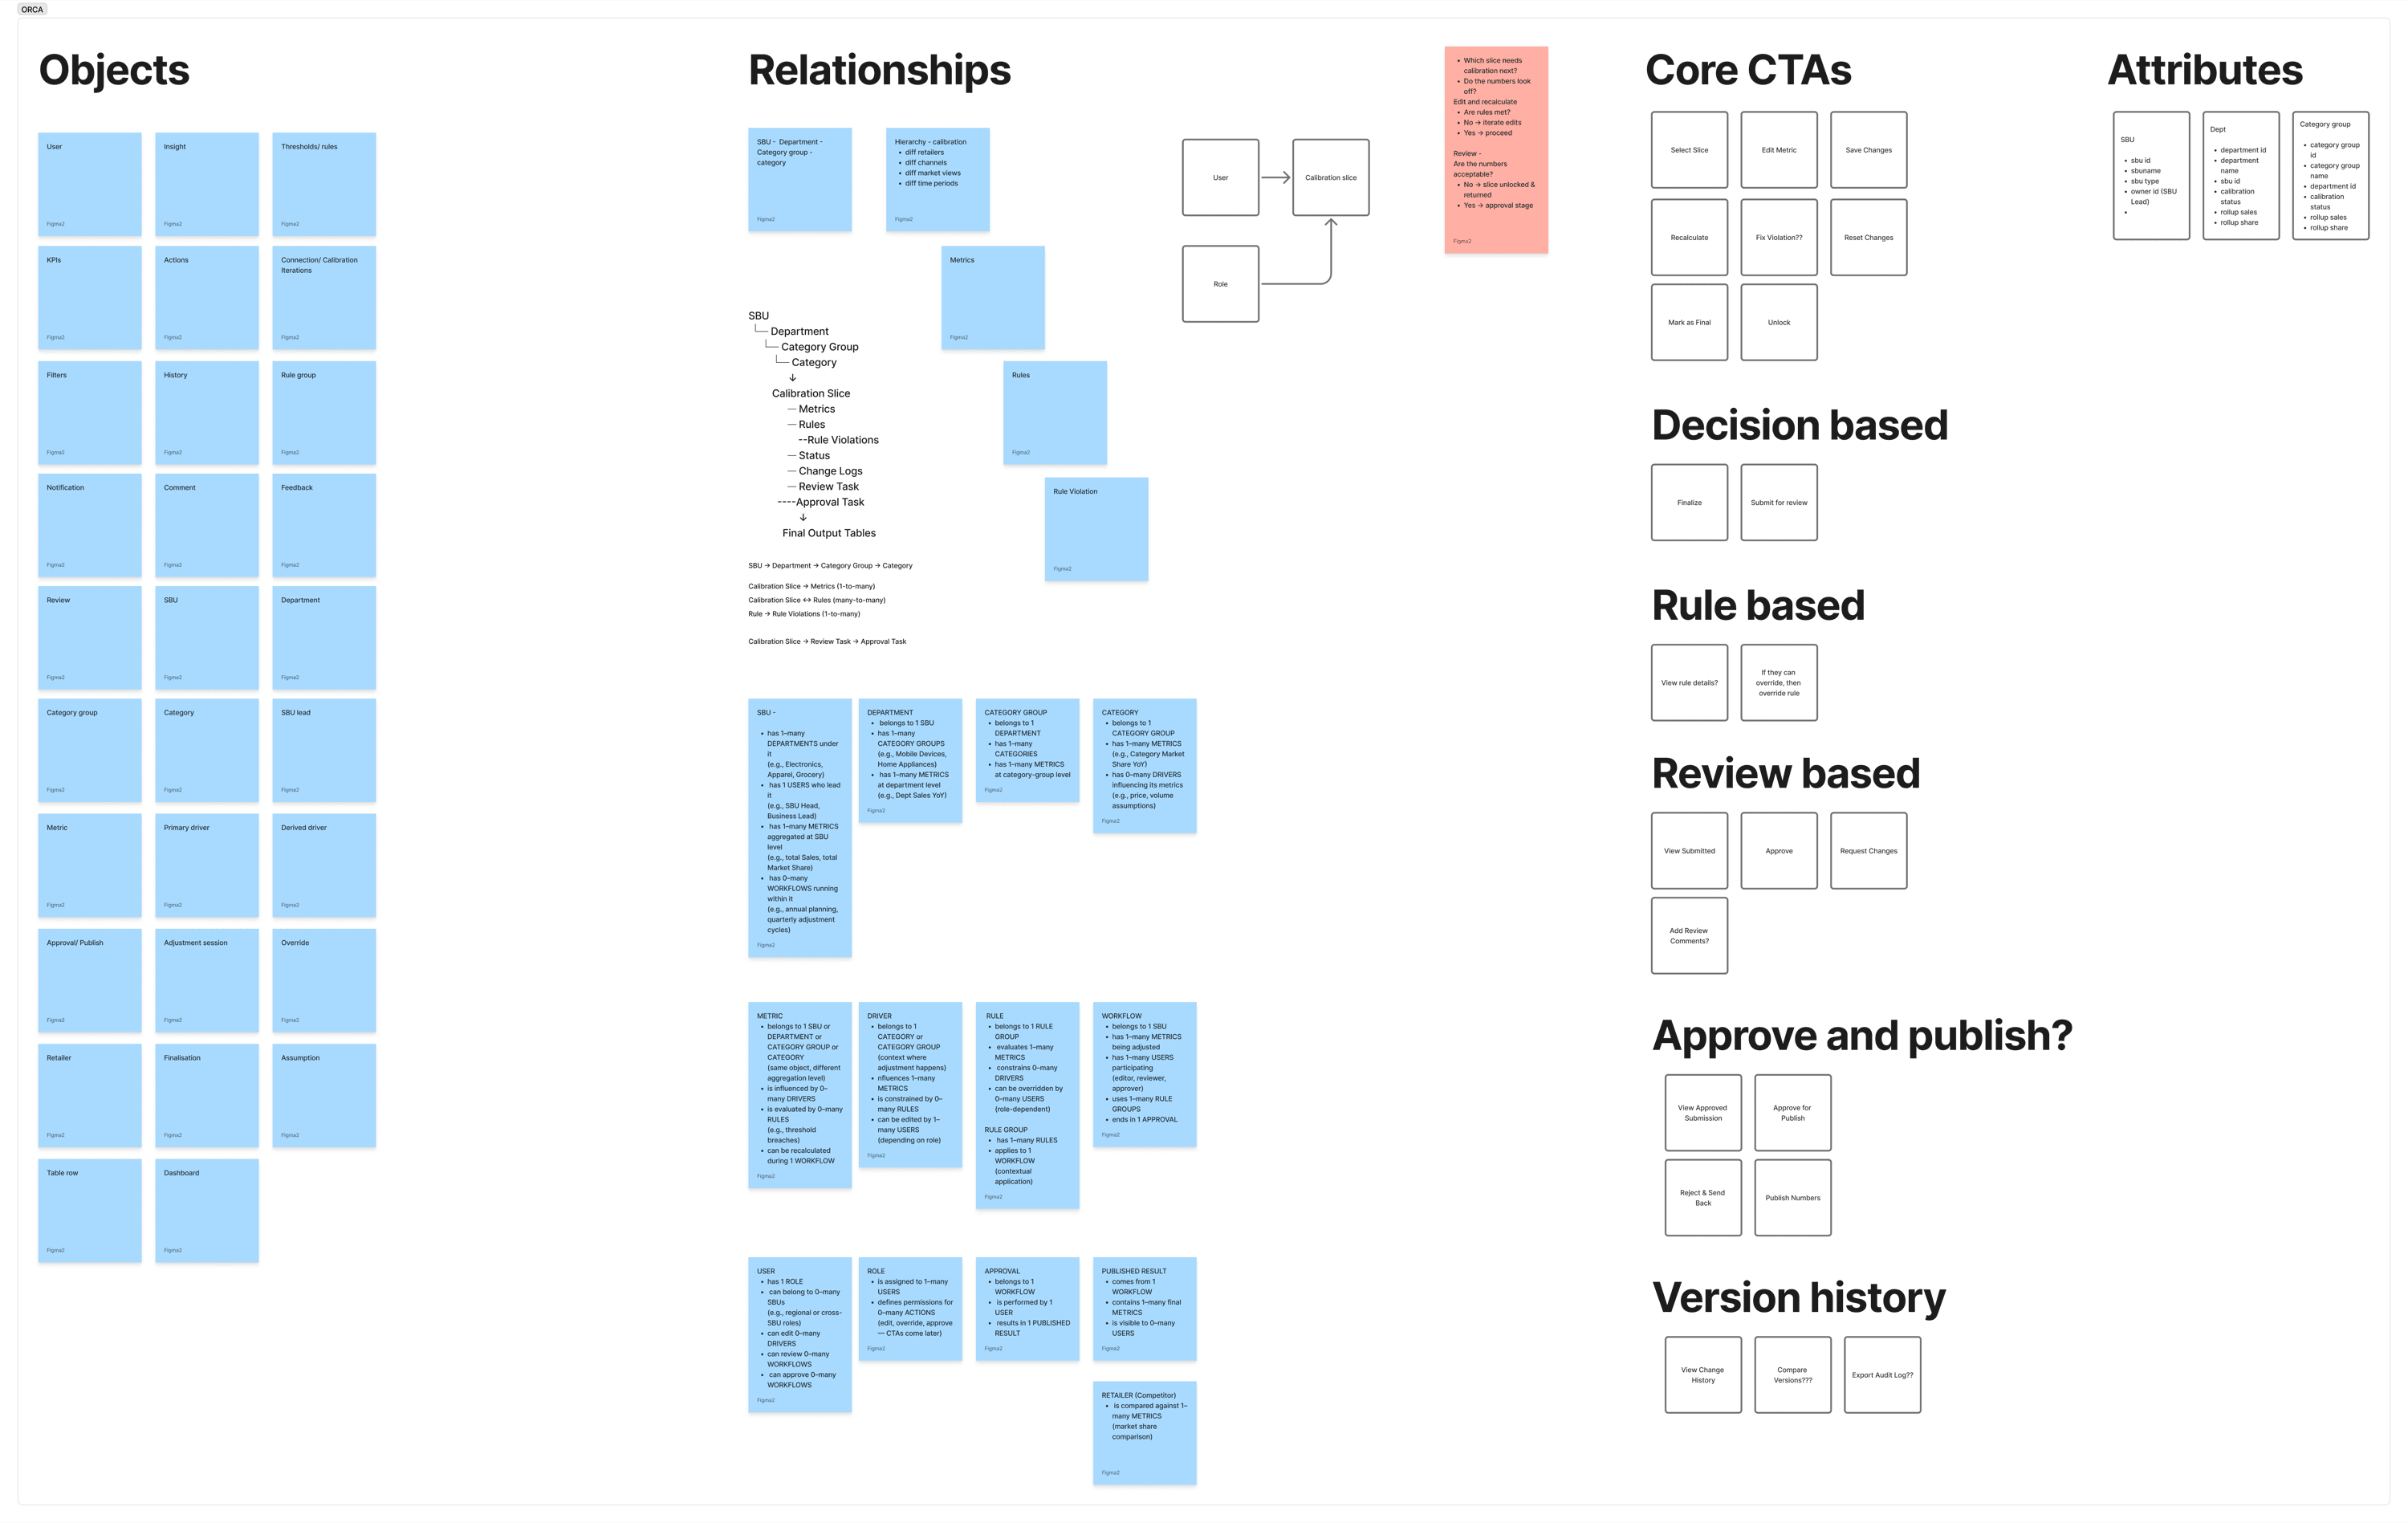
One object at the centre
The OOUX map is where the roll-up problem became really clear. Everything a team touches is one thing: a calibration slice, like Department · Total market. Metrics, rules, status and the change log all hang off it, and every sign-off runs out of it.
A number goes past the threshold
Rule violation
Rules run against the slice and raise a violation. That’s the flag the AI shows you.
A late edit lower down
Change log
Every edit is logged against its slice, so the impact review can show what it touches, including numbers someone already signed off.
The next team’s turn
Status
A slice only opens when its stage does. Completing one stage unlocks the next.
So the screens didn’t start from a table. They started from this.
Every action, sorted into modes
Every action on the ORCA board got sorted by what it’s for. That’s where the screens came from: separate modes, instead of one huge table doing everything.
Calibrate
Judging the numbers
- Select slice
- Edit metric
- Save changes
- Recalculate
- Reset changes
- Mark as final
- Unlock
Resolve rules
When something’s flagged
- View rule details
- Fix violation
- Override rule
Decide
Finishing your stage
- Finalize
- Submit for review
Review
The next team checks it
- View submitted
- Approve
- Request changes
- Add review comments
Approve and publish
Sign-off
- View approved submission
- Approve for publish
- Reject and send back
- Publish numbers
History
Who changed what
- View change history
- Compare versions
- Export audit log
The decisions that shaped it
These are the calls that turned the object map into the tool.
- 01
The order is enforced, not remembered.
Stages unlock one after another, so nobody edits out of turn. In Excel, the order lived in people’s heads and email threads.
- 02
The AI flags, the person decides.
The agent goes through every row and suggests a number. But nothing moves to the next team until a person completes the stage.
- 03
The summary leads with the problem.
The first screen says what’s blocked in one sentence, like “07 departments remain blocked due to pricing issues”, with two ways in: the blocked ones, or all of them.
- 04
Every number shows its working.
Last month’s reported value, the calibrated value and the raw value sit side by side, so you can judge a change instead of just trusting it.
- 05
You see the impact before you commit.
Because the numbers roll up, the review shows what your changes touch, including numbers someone already signed off.
- 06
Edge cases get designed, not left.
When there’s nothing to compare against yet, the screen says so. Edits are saved or discarded on purpose. And a rule picked for one run doesn’t quietly become policy.
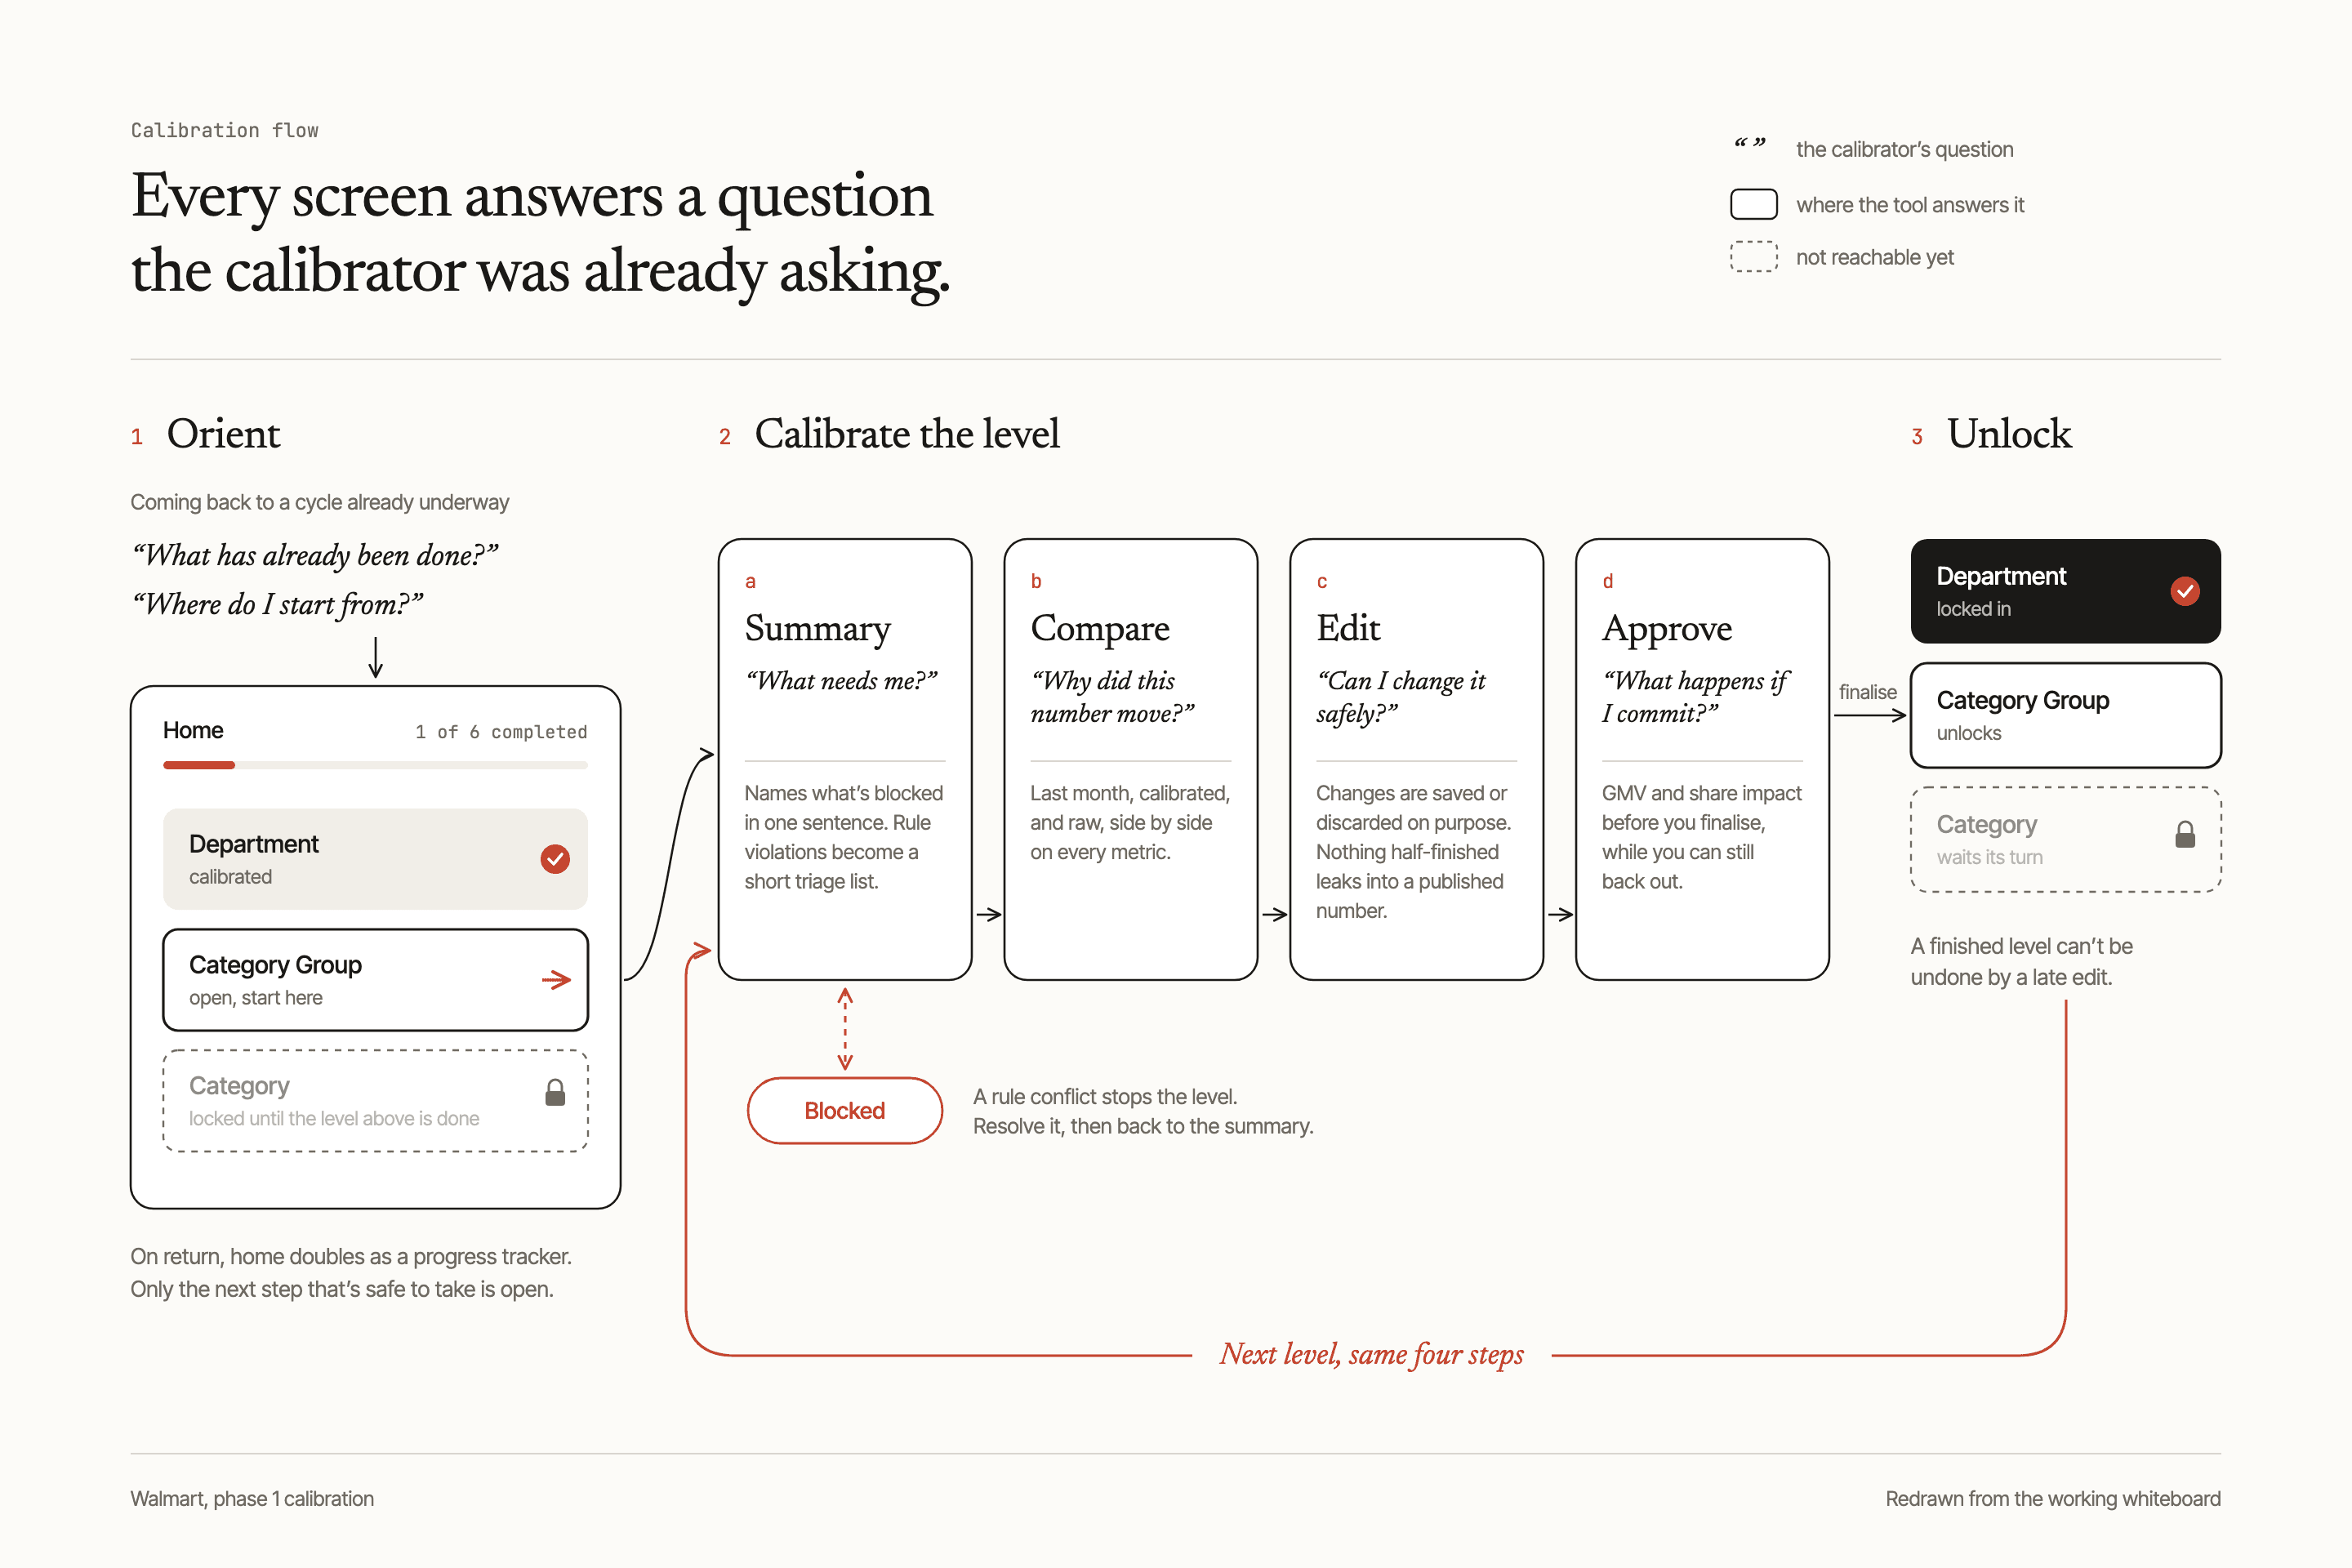
Final design
- 01
Stages that unlock
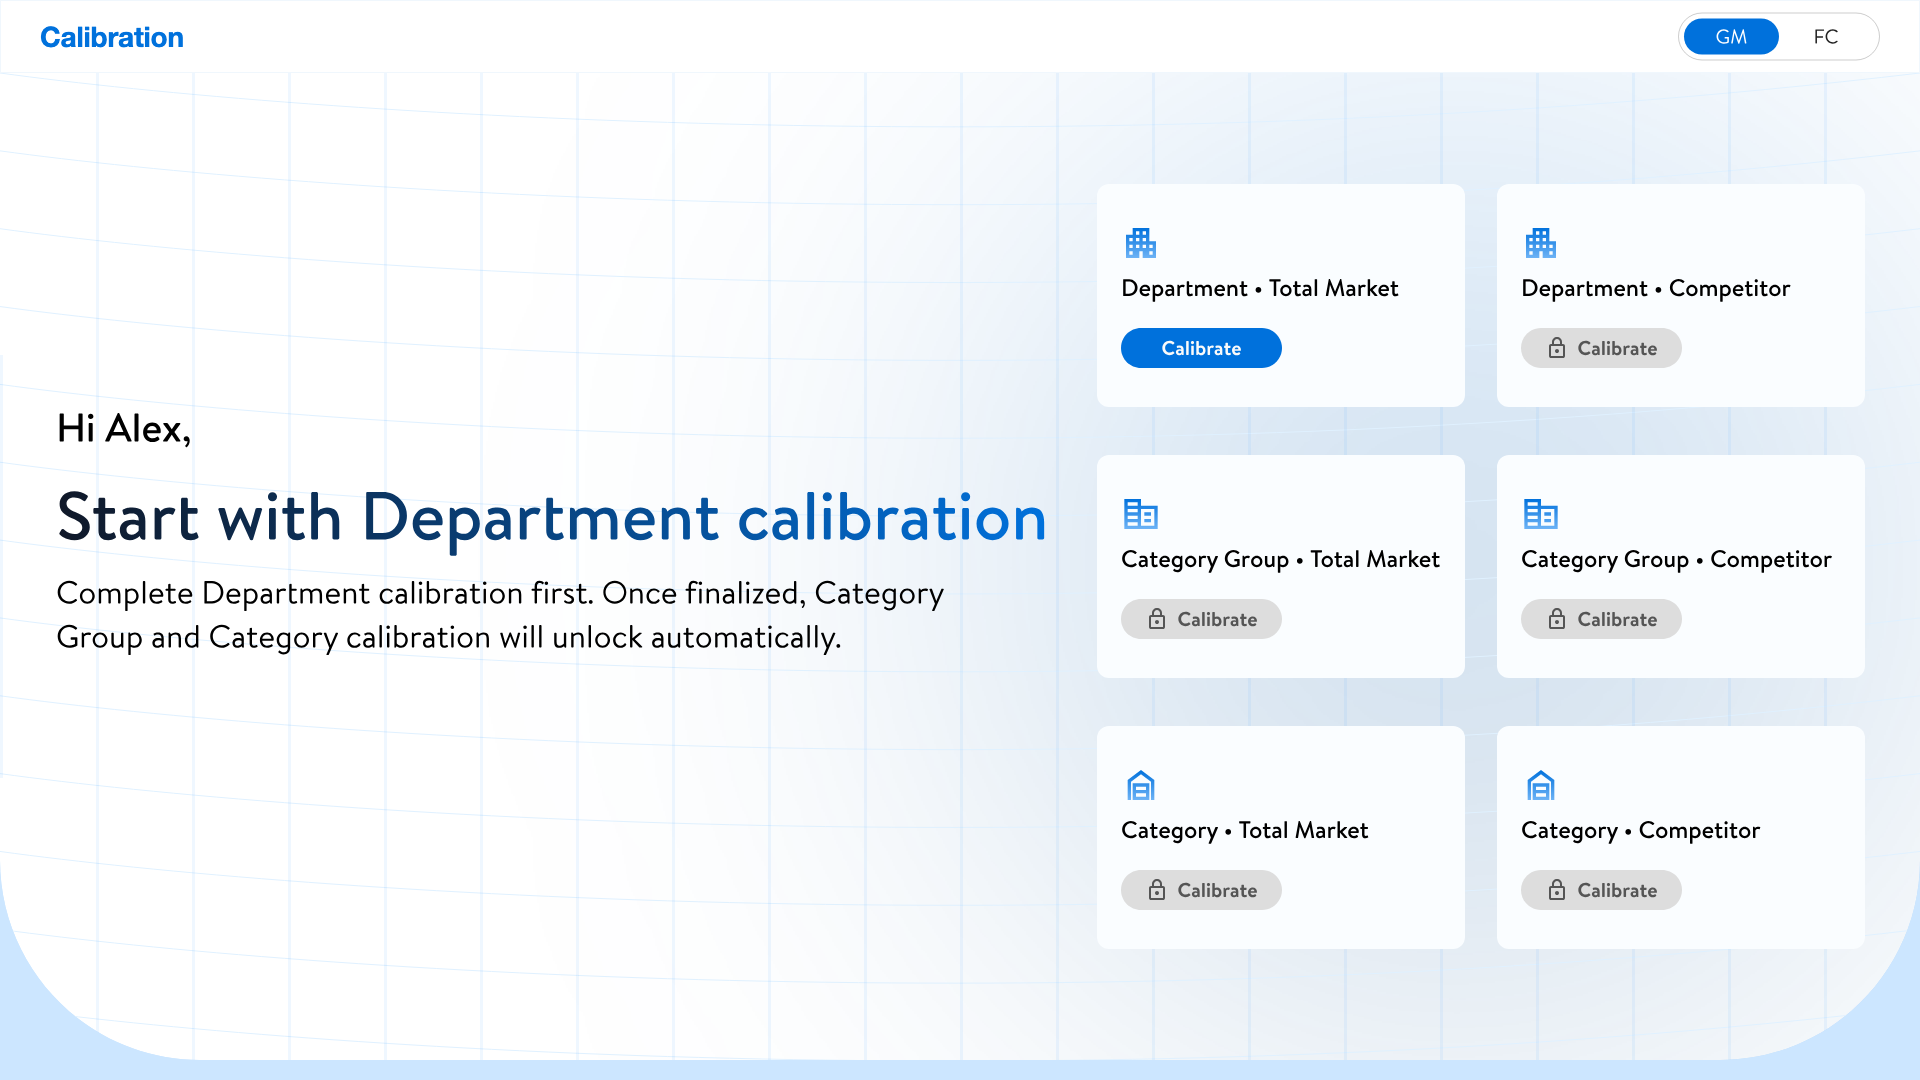
The home screen. Only one card is open, the one the data model says you can start with. This wasn’t there before in Excel. One team finishes their stage, then the next team unlocks. So people aren’t editing things out of turn.
- 02
Where are the flags?
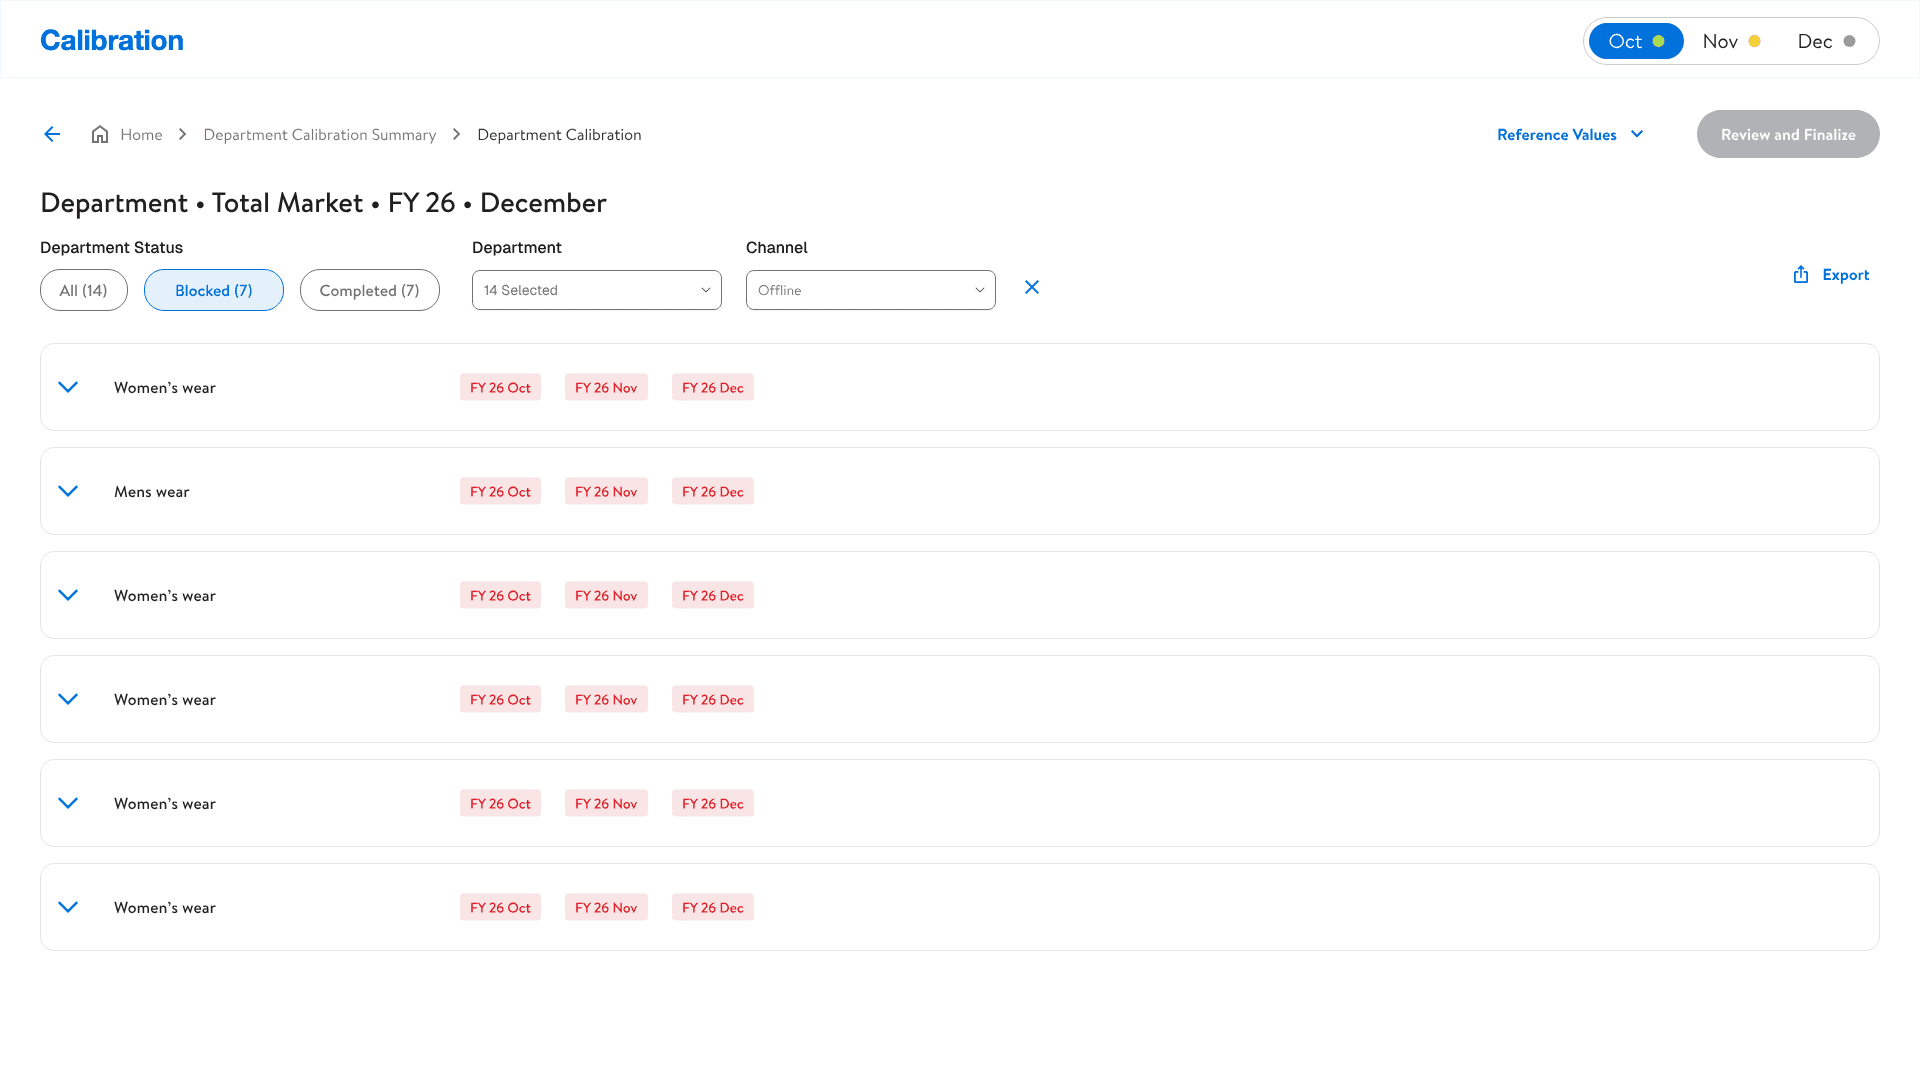
The blocked queue. Each filter shows its count, so you can see how big the job is before you open anything. Before you open any data, you can already see where the flags are. Women’s wear has 3 flags, so you know where to go.
- 03
The table
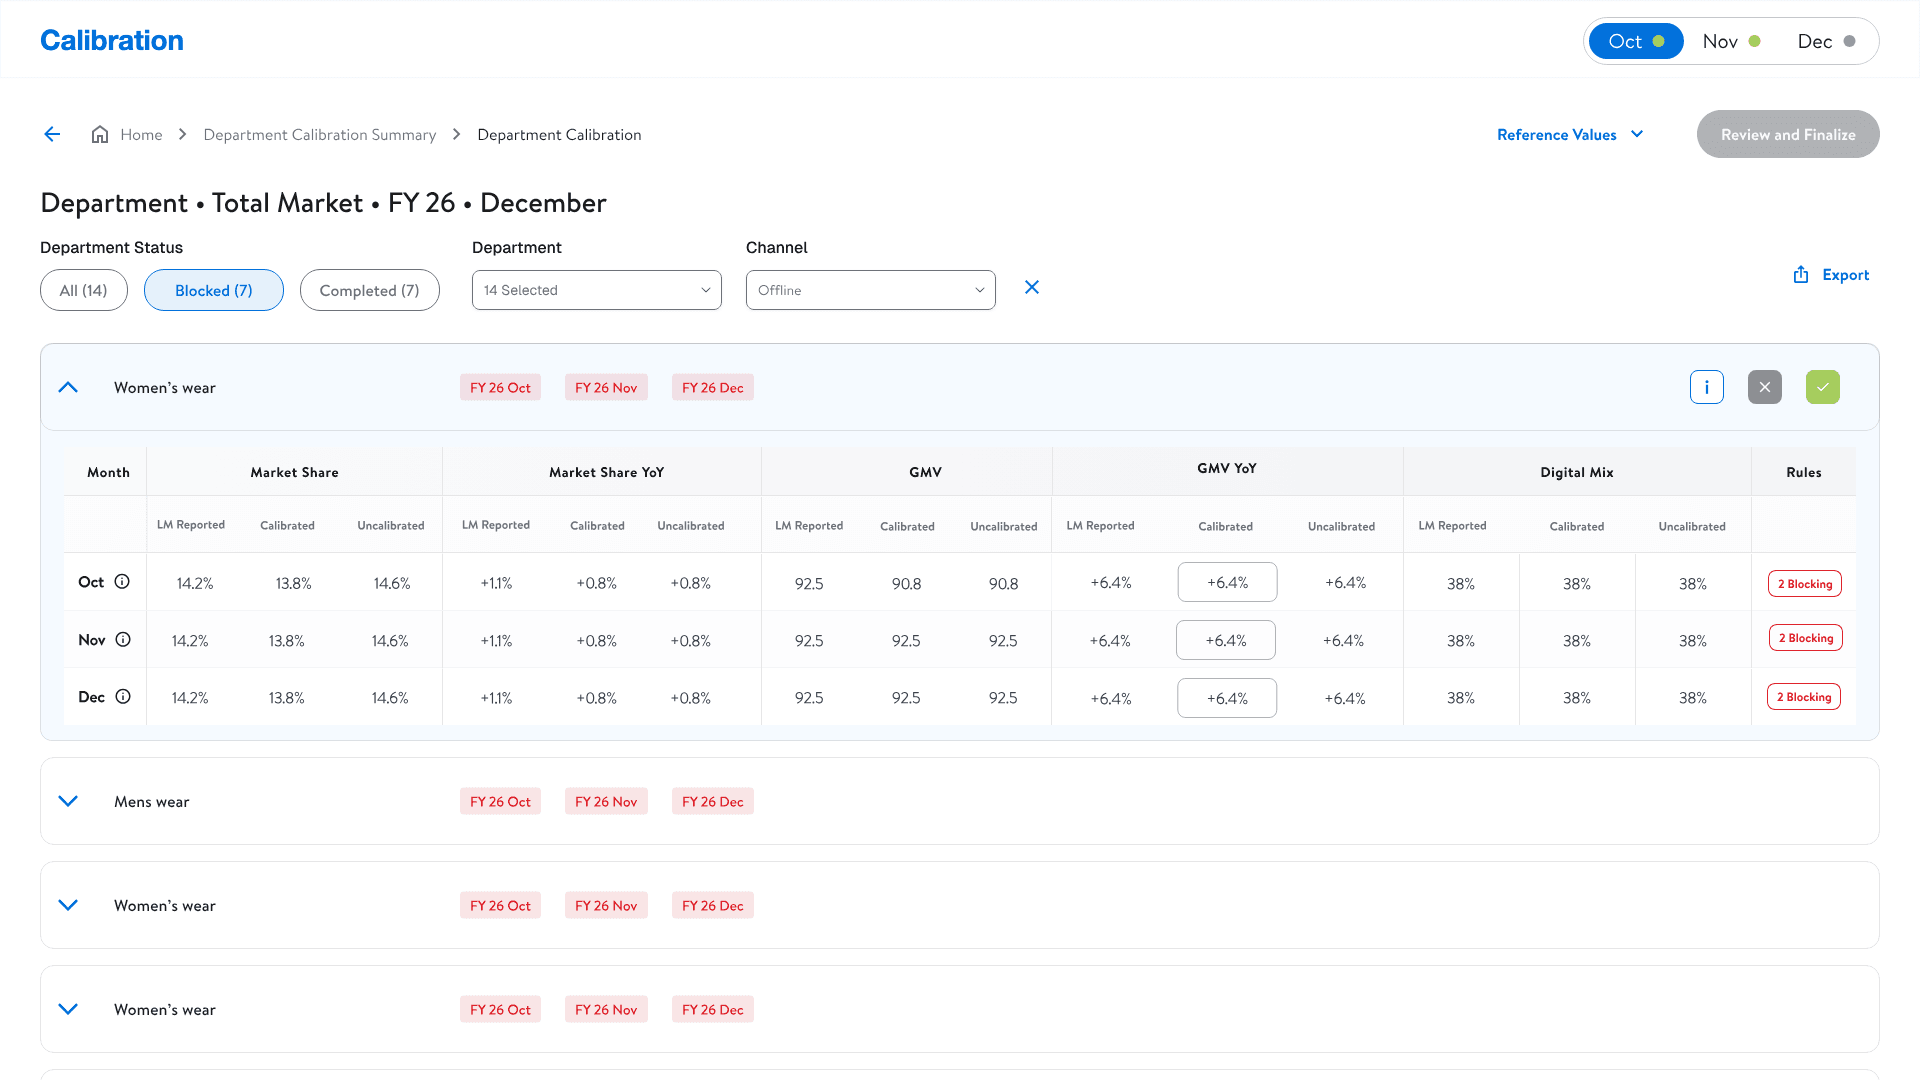
The Department Calibration table. Every metric shows LM Reported, Calibrated and Uncalibrated, so you can always see how far a number moved. Every row shows the number they bought, how far it is from their own data, and what the AI suggests. If it goes above or below the threshold, it’s flagged. Everything else just stays quiet.
- 04
Change it or accept it
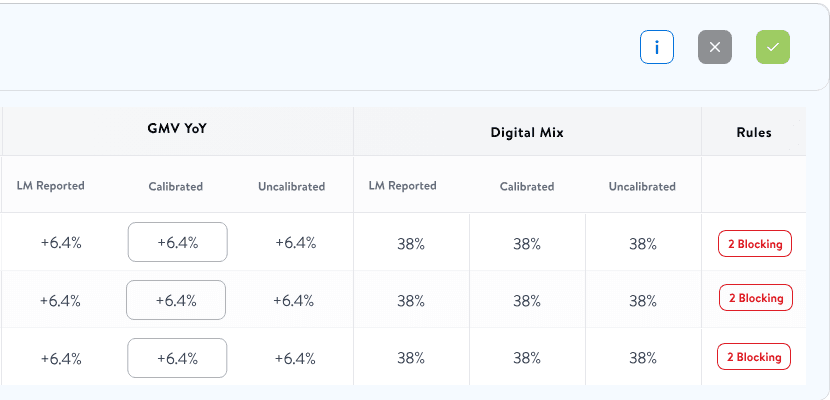
Calibrated values are edited in place. The tick and cross accept or reject the row. You can change the number right there, or just accept what the AI gave. Once you’re done, the flag goes away.
- 05
Check before you’re done
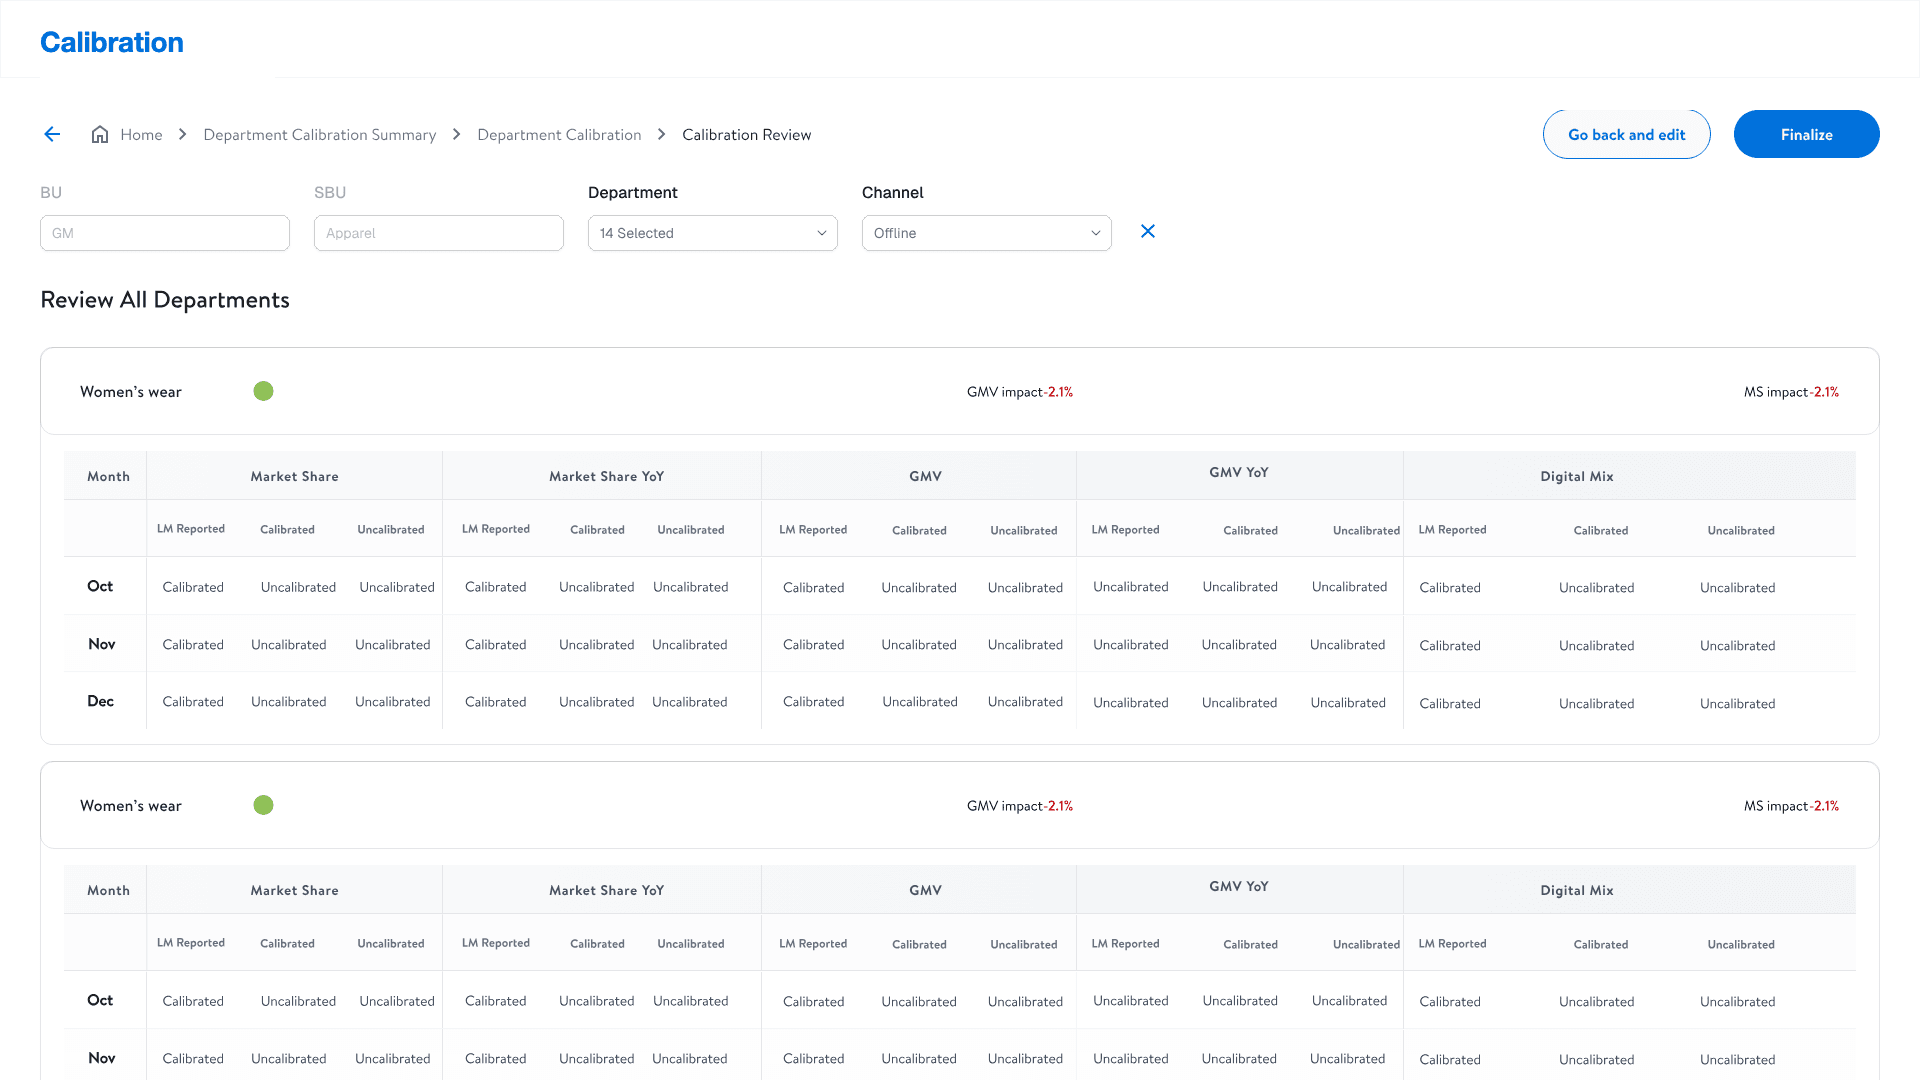
The review step, where you check each department’s impact before you finalise. Before you complete your stage, you see what your changes affect. Because the numbers roll up, this is where you catch a change that would mess with another team’s sign-off.
- 06
The next team unlocks
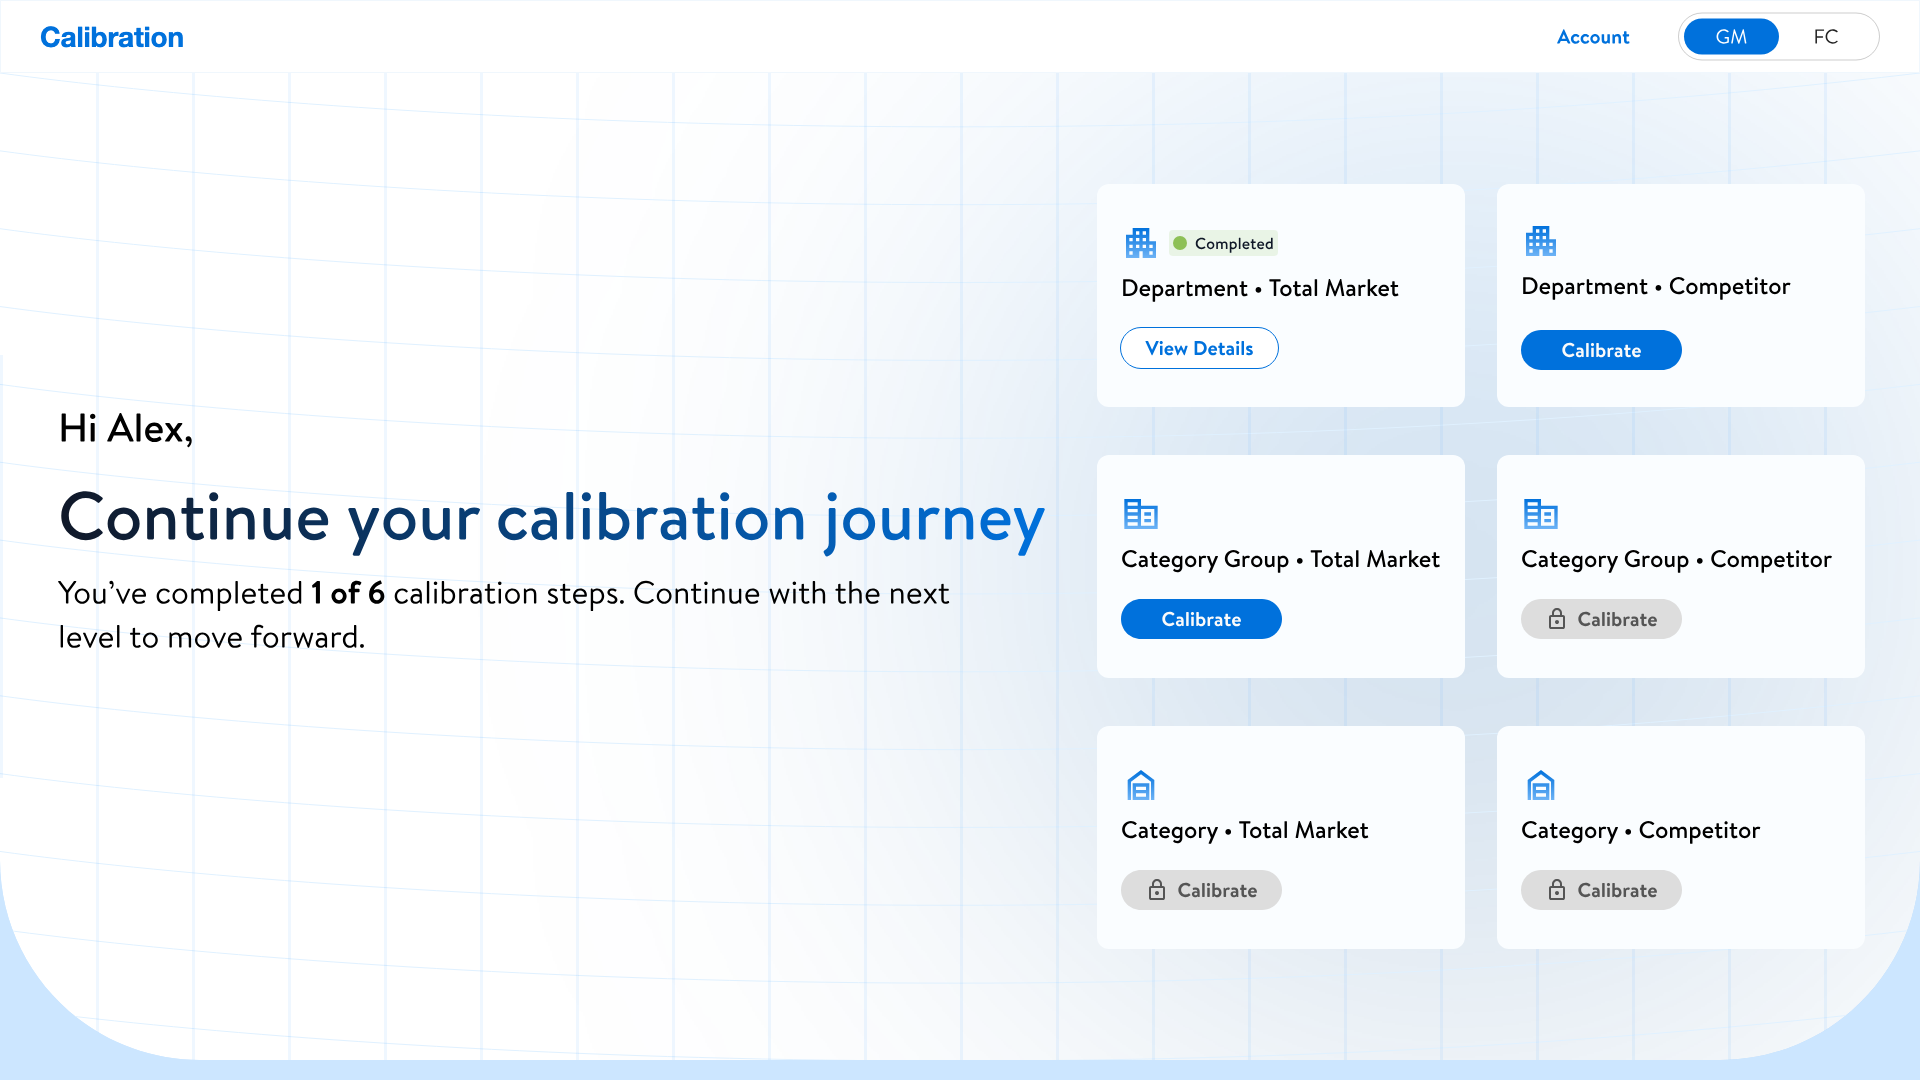
When you come back, the same screen tracks your progress. Here one of six steps is done and the next level has opened. You complete your stage and the next team unlocks. Nobody has to message everyone saying “I’m done.”
Outcome
- Per cycle, down from ~210
~45 h
Per cycle, down from ~210
- Calibration loop, down from two to three weeks
Days
Calibration loop, down from two to three weeks
- Monthly saving realised for the first business unit
$3.5K
Monthly saving realised for the first business unit
- Teams moved from sequential to parallel
4
Teams moved from sequential to parallel